The Scale of Farm Program Benefits
There’s a lot of talk these days about farm bill equity in relation to scale. Many advocates call for adjusting farm program benefits according to scale, to give more benefits to smaller “farms” and less to larger farms, especially if they grow only corn and soybeans, for example, in the corn belt. This paper teaches an answer to some of these issues. It’s really quite interesting. I also have a slide show that examines more of the issues.
This paper uses some historical examples, some historical context. In part I’m thinking of the 1980s to early 90s when Republican President Ronald Reagane was in office. The 1980s was also a time when Family Farm (Farm Justice Movement leaders made bold proposals to restore adequate updated versions of the earlier New Deal “parity” farm programs of 1942-1952. Populist Democrats in Congress turned these proposals into actual bills. These included the Farm Policy Reform Act, introduced in Congress as the Harkin-Alexander bill,https://familyfarmjustice.me/2016/12/10/the-farm-policy-reform-act-of-1985/ and the Family Farm Act of 1997, introduced in Congress as the Harkin-Gephardt bill. https://familyfarmjustice.me/2016/12/09/family-farm-act-of-1987/
I’m also thinking in terms of the Environmental Working Group’s (EWG) Farm Subsidy Database, which started in 1995. https://farm.ewg.org/region.php?fips=00000®ionname=theUnitedStates Based upon EWG data, I did some data analysis of farm subsidy recipients for the years 1995 to 2010. This paper is partly based upon that earlier work. https://znetwork.org/zblogs/most-ewg-subsidy-recipients-are-too-tiny-to-be-farmers-by-brad-wilson/ EWG’s approach has had massive influence in America, where hundreds of newspaper and other editorials supported it. https://familyfarmjustice.me/2018/04/27/mainstream-media-misunderstands-the-farm-bill/ It may also have had an influence in Europe, where similar analysis has been presented. http://znetwork.org/zblogs/farm-subsidies-rebutting-europe-s-kickaas-by-brad-wilson
Stimulated by the work of EWG, in the 21st century there has been a major rise of a Food Movement, an Environmental Movement that focuses on the farm bill, and related sectors and subsectors. At times they have emphasized, for example, comparisons between EWG’s top 10% of farm subsidy recipients, those who have received the most money, and those farther down on the list. The contrasts are quite shocking, (until you read my analysis of the data, as linked above, and see my slide show, Politics, Farm Size and Agribusiness, also linked above). As I showed in the link above, this is a myth, and it is also a major context for this paper.
Who Really Favors Growing Less Corn and Soybeans?
Ok, let’s look at some different farm sizes, subsidies, and proposals to grow less corn and soybeans. Here are the average yearly subsidies for corn and soybeans as seen in the Farm Subsidy Database for 1995-2010.
Starting in the middle at the 50% mark, (top 50% or bottom 50% mark,) are the recipients who got subsidies, on average, as shown. Moving up to other top percentage marks in the Farm Subsidy Database we see these amounts.
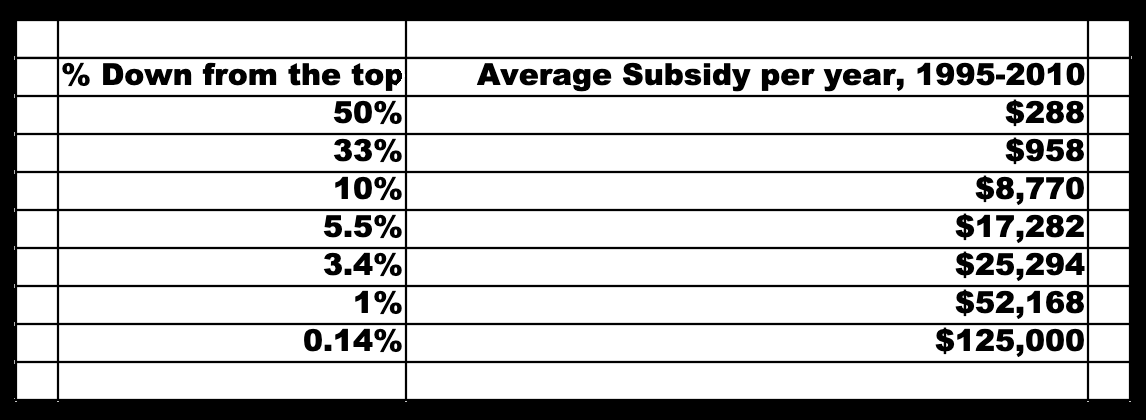
Naturally, it has seemed unfair for so many people that some “farms” (recipients,) got so much more than others. So they’ve called for giving less at the top, and more and the bottom.
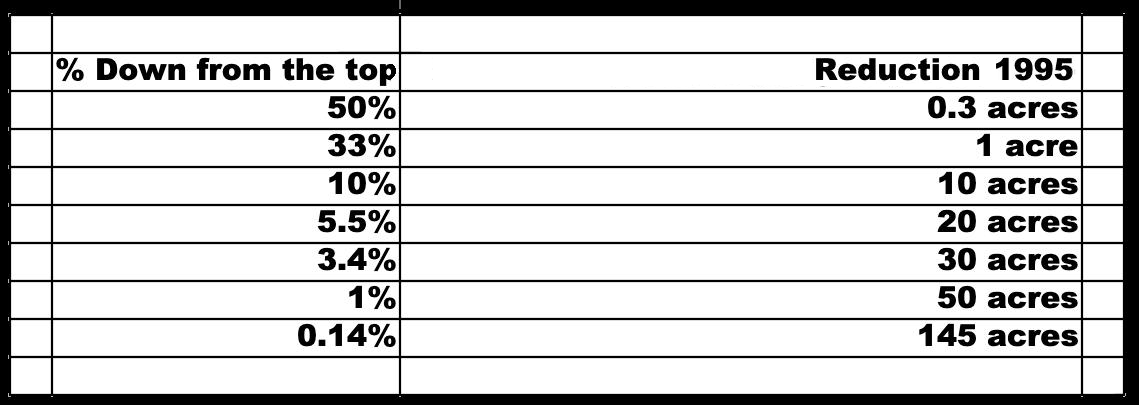
There is more to the story, however. Earlier farm programs had Supply Reduction, (acreage “set aside,”) requirements. For example, the 1990 farm bill required a 10% reduction of corn acreage for 1995. (That was ended by the Republican Congress in the 1996 farm bill.) Here’s what that would mean for the farms (& “farms”) in this example.
Here’s a comparison for anyone concerned about the impacts of corn and soybeans, for example, with regard to it’s impact on water quality. Here we look at WHO proposes legislation where corn and soybean acres are reduced.
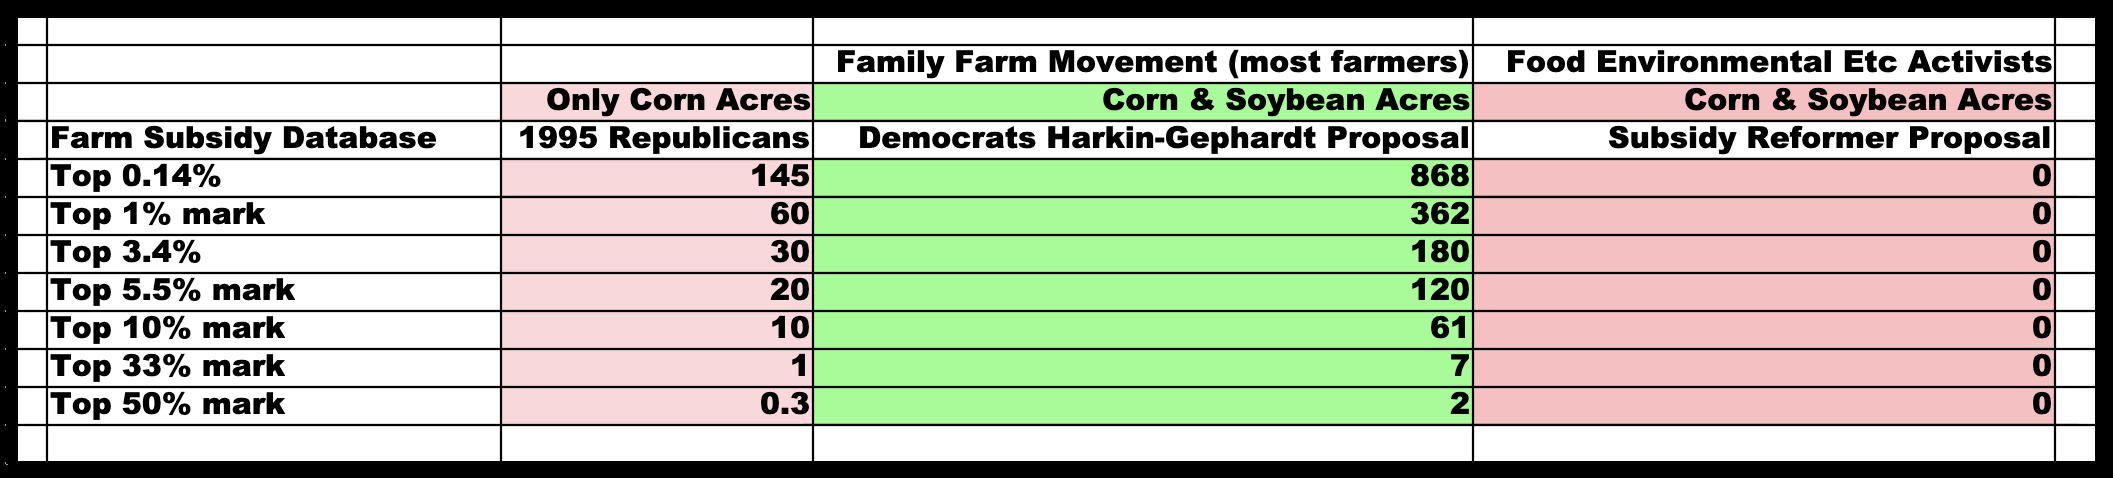
We see, then, that even the Republicans, (prior to 1996,) called for reductions in corn acres, (with the biggest reductions for the biggest farms, while the progressive Food and Environmental Movements, (including the Environmental Working Group,) propose no legislataion that reduces corn and soybean acres, even for the biggest farms! Likewise, the Sustainable Agriculture/Organic Movement sectors, (including groups like the National Sustainable Agriculture Coalition,) proposes no reductions in corn and soybean acres. On the other hand, the Family Farm (Farm Justice) Movement, (in this example from the 1980s, and representing most farmers, has proposed even larger reductions, for both corn and soybeans. (Today there are more moderate proposals from the National Family Farm Coalition, National Farmers Union, Texas Farmers Union, and Campaign for Family Farms and the Environment. WHY do you suppose the Food/Environmental/Etc. Farm bill advocates propose no reductions in corn and soybean acres, even for the largest farms, while even the Republicans have done so in the past?
Well, I think the answer is quite simple. These newer advocates really don’t at all listen to the Farm Justice Movement that represents most family farmers. Therefore they don’t know the history of the farm bill, and they don’t know what the proposals of the Family Farm Movement have been, or even that they have ever had proposals. And therefore, they don’t really even know that there have ever been farm bill requirements to reduce corn and soybean and other acreages, (i.e. wheat, cotton, rice, grain sorghum, barley,) or proposals to increase the reductions.
Another Example, Based Upon My Previous Work
Here’s another example four farms (& “farms”*) of differing sizes growing corn, soybeans and oats based upon this slideshow. https://drive.google.com/file/d/1MeAFcvknpJJ86xW00OJM2iX1qvbPy2nP/view?usp=share_link Full cost numbers are full economic costs or the equivalent, as measured by USDA’s Economic Research Service. 1980-2005.
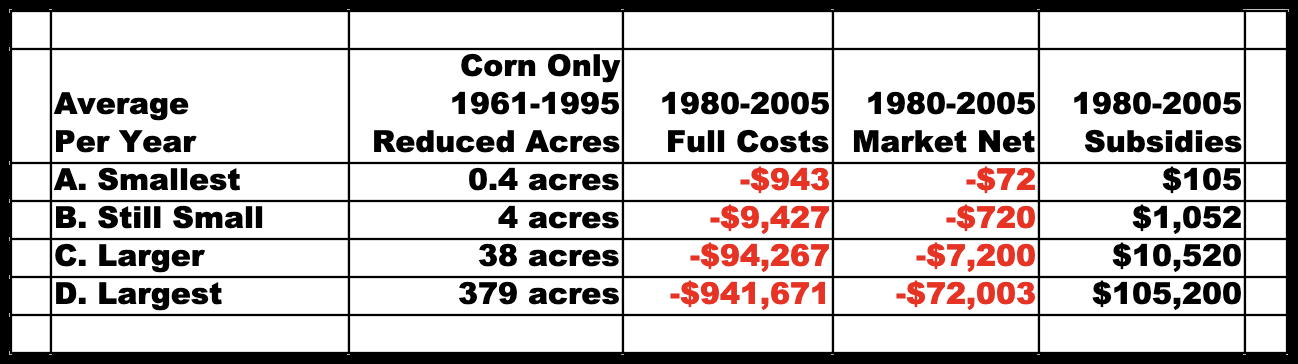
Here we again see that the actual farm bill had reduced acres for corn, (and other crops, but not including soybeans,) and required the largest farm to have the largest reduction in corn acres. At the same time, the largest farm received the most subsidies. The largest farm also had the largest costs, (full economic costs,) costs of nearly a million dollars in this example. In contrast, the smallest “farm”* had costs of less than $1,000. Should the “farm”* with less than $1,000 in costs get many more subsidies, like the largest farm, with costs of nearly a million dollars? That’s what many have argued and proposed. Of course, they don’t know about the rest of the story, part of which I’m showing here, and see further the slide show and article linked above, which goes into more detail.
Why Did the Sustainable Family Farm Movement Reject Farm Justice? And a Proposal
A major setback to farm bill reform was the splitting off of a Sustainable Family Farm Movement from the Family Farm (Farm Justice) Movement during the 1990s. This negatively influenced many other farm bill advocates who share our values during the 21st century, such as the Food Movement and the Environmental Movement advocates working on the farm bill, and various subsectors. We were divided, to be conquered, and we still are.
I see several key factors in this failure. First, the Family Farm (Farm Justice) Movement failed to adequately address the issues of sustainable agriculture. A second factor is related to the first. The Sustainable Family Farm Movement misunderstood the impact of the New Deal style farm programs, thinking that they rewarded corn and soybeans, for example, when in fact these crops were penalized more than more sustainable crops and livestock enterprises. At the time, no one, including me, looked at the full data, drawing false conclusions. A third factor is that foundations and other funding sources were influenced by all of this, and de-funded farm justice, while ramping up funding for sustainability.
During the 1990s, Iowa CCI offered a radical solution to this rising divide, through its concept of “Farming with Fewer Chemicals.” Sure, it doesn’t sound radical. What makes it radical is that it was nonthreatening to conventional farmers, focusing on both reduced chemical farming and organic farming. Iowa CCI brought the two sides together in a united way.
One key missing narrative was the story of how Congress, in reducing and later ending minimum farm price floors and supply reductions, forced farmers to increasingly subsidize CAFOs, with most farms in major farming states then losing all value-added livestock and poultry, to then lose all of the “sustainable livestock crops,” pasture, hay, and the nurse crops for these, like oats and barley, to then lose the infrastructure and infostructure for diversity on farms, in rural communities, and across rural regions. Losing farm justice was devastating to sustainability and the farm environment. To this day, the National Sustainable Agriculture Coalition and the Food and Environmental Movements unknowingly support this, the most massive subsidization of CAFOs, paid by farmers. https://www.slideshare.net/slideshow/how-cafos-are-subsidizedpdf/256563076
Another fascinating narrative factor is that the Sustainable Family Farm Movement called itself the “Sustainable Agriculture Movement,” benefitting everyone. In contrast, the “Family Farm” Movement, in neglecting to emphasize “Farm Justice,” especially as a key to sustainability, ended up being seen as offering very low-grade benefits, the self interests of “family farmers,” most of whom were conventional farmers. The new Food and Environmental sectors, sometimes included this, but it was listed farther down on their lists of priorities. The Family Farm Movement offered no narrative emphasizing that this was a multi-trillion dollar issue that was behind the massive destruction of sustainability on farms. Nor did they offer much of a criticism of the mere subsidy reforms that these other groups were offering. Mere subsidy reforms preserve the massive subsidization of CAFOs and agribusiness concentration.
A Proposal. To me, a key farm bill mistake over the decades, and another factor behind the division in our movements was that supply reduction programs made the same requirements on farms that produced only corn and soybeans, 50-50, as they did for farms which already produced less corn and soybeans, such as one with a four year rotation of oats-hay-corn-soybeans, (25-25-25-25). The value of diversity, so obvious today in light of the dead zone in the gulf, the water quality crisis, the rising cancer rate, and the various other problems of agriculture today.
I propose that future New Deal style proposals require bigger supply management reductions for farms with less diversity. This would mean that the bigger corn-soybean farms would do even bigger reductions of corn and soybeans than in my examples above.
*Appendix: Farm Sizes in the Examples
Here are the farm (or “farm”*) sizes in the first example. They were calculated based upon average subsidies per acre.
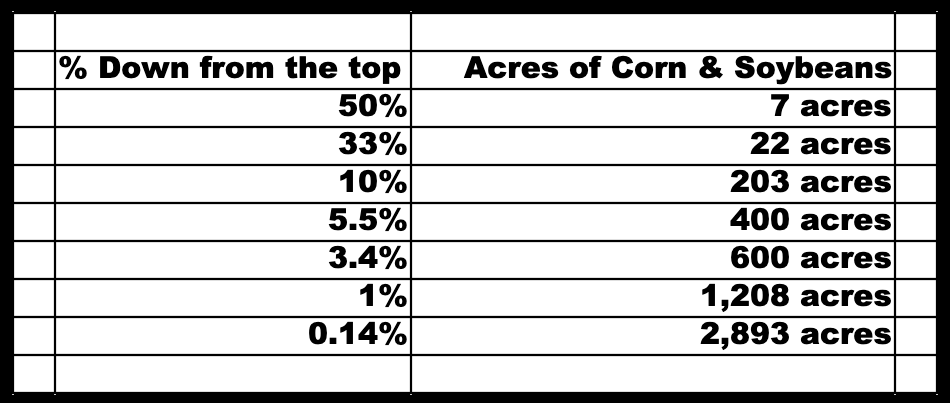
If you were growing corn and soybeans during these years, 1995-2010, you would not be a full-time farm at the small sizes, even at 203 acres and more in the top 10%. Of course, none of the critics have done the math on this. They haven’t known that they were asking for part-time farms and tiny acreages to get the same subsidies as full-time farms.
Here are the farm (or “farm”*) sizes in the second example. They were chosen by me to illustrate my points.
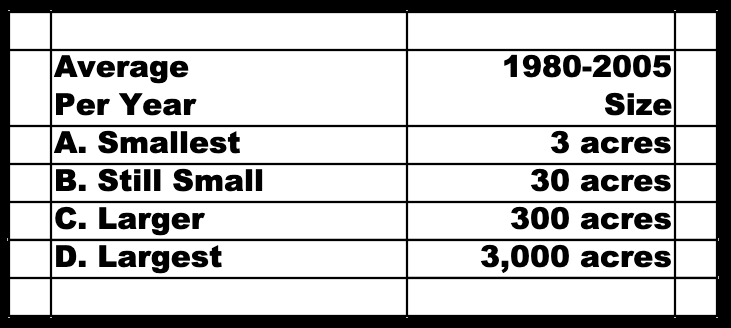
Here again, the smaller farms are not big enough to be a full-time family-sized farm. Is a 300 acre farm growing just corn and soybeans big enough to be full time, with $3,320 in net returns, (including $87,067 in gross market income, a loss of $7,200 in market income (and $10,520 in subsidies,) after full economic costs are subtracted?
EWG uses the term “recipients” for those receiving subsidies in the Farm Subsidy Database. Others translate that into “farms,” without regard for, or without knowing, that most recipients are too small, usually far too small, to be full-time farms.
