Author’s Note: This paper presents background material in support of my slide show series on “The Decline of Agriculture” in 42 counties in Iowa, (with summaries of these counties for each Congressional District, and with a survey of all of Iowa). County level data from the Census of Agriculture is used to show how cheaper and cheaper farm prices, leading to reductions in the farm economy have forced farmers to subsidize animal factories, (Confined Animal Feeding Operations, CAFOs,) with cheap, below cost feed ingredients. This farmer-paid subsidization has then led to the further penalty where most farmers have lost all value-added livestock and poultry. Without livestock, most farmers have then lost the sustainable “livestock crops,” grass pastures, alfalfa and clover hay, and the nurse crops for these, like oats. These “Environmental Impacts” are the focus of Part 1 of my surveys. 25 additional state summary surveys are also being developed. These are the core, systemic policy issues for agriculture and the environment.

In the map above, the darker counties are the ones surveyed. Links to the slide shows are found farther below. A preliminary survey for Wisconsin is found here. https://www.facebook.com/media/set/?set=a.3719393414781721&type=3. Part 2 slide shows focus on “Farmer Impacts” (see below).
Understanding the Core Environmental Policies for Agriculture
From the crisis of the Great Depression, the Farm Bill was invented and implemented, fairly slowly, during the 1930s to 1941. At it’s core, it was a market management solution to at least six decades of prior crisis caused by cheap farm prices. Minimum farm price floors, (similar in principle to minimum wage,) were implemented and backed up by supply reductions, as needed, to balance supply and demand. For consumers and industry, price ceilings were used, to trigger the release of reserve supplies during times of drought and shortage.
The second national crisis of World War II led Congress to raise minimum farm price floors to “living wage” levels, 85% or 90% of parity with a goal of prices at 100% of parity. This was seen as a government managed, private sector economic stimulus, (not a government spending stimulus,) and was passed, in part, through the banking committees.
The farm program worked well, raising farm prices to “living wage” levels, and at minimal or no cost, even making money for the government through 1948. Agriculture as a whole achieved 100% of parity every year, 1942-52.
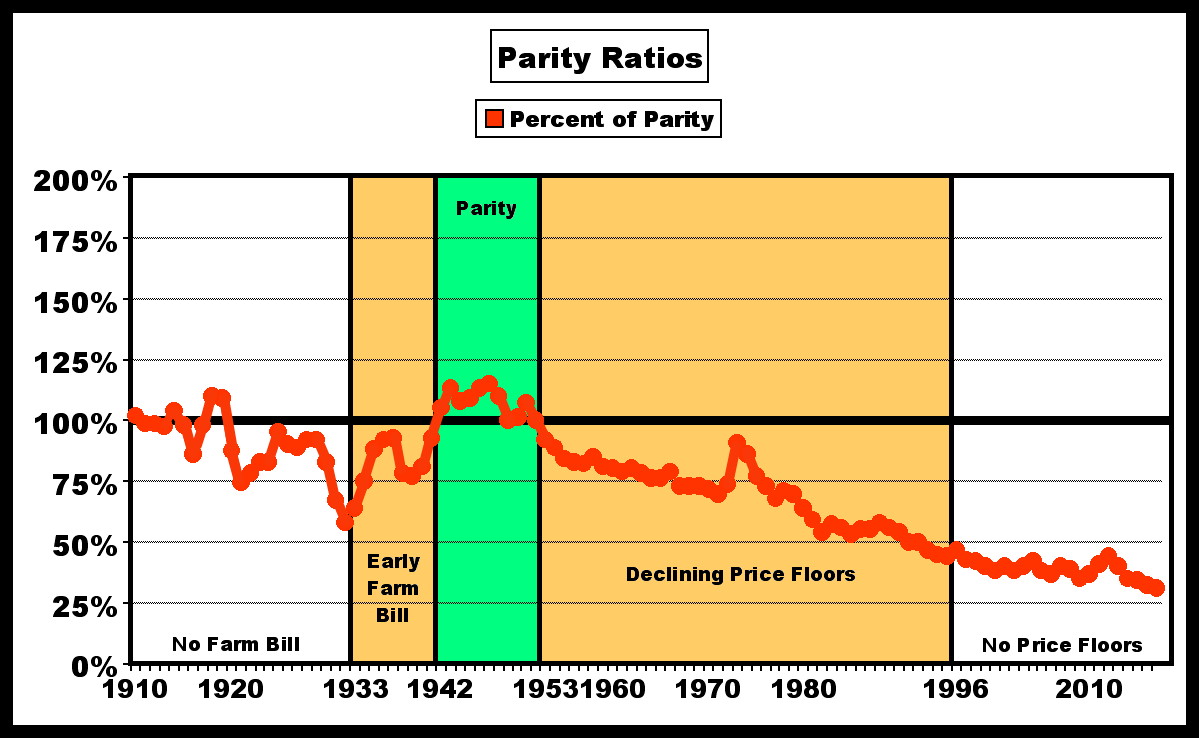
The agribusiness buying corporations were forced to pay farmers $1.2 trillion more, (1942-52 vs. averages from 1920-32).

For 1933-1960, an estimated 99% of the impact was from minimum farm price floors, and only 1% from farm subsidies.

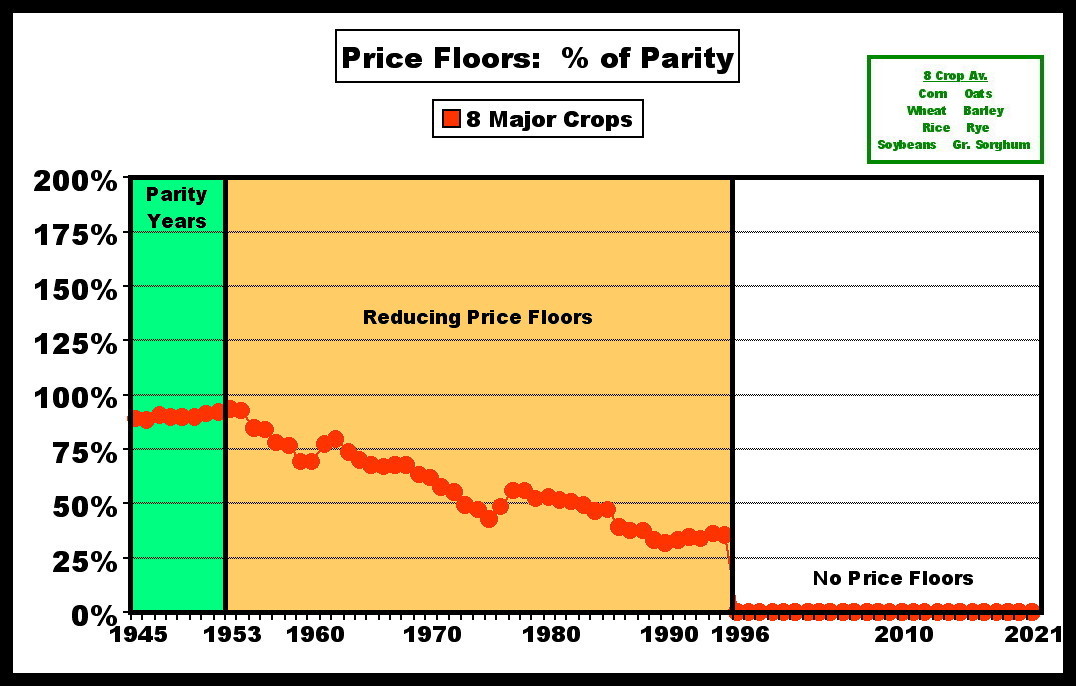
Congress then lowered minimum farm price floors, more and more, 1953-1995, and then ended them, (1996-2023). This had devastating impacts on farmers, rural communities and the rural environment. Over time it forced farmers to massively subsidize the loss of their value added livestock to CAFOs, with cheap feed ingredients, (below full cost levels most of the time at least since 1981). With cheaper and cheaper prices, net farm income fell low and stayed low, even with higher yields and with implementation of the major farm subsidy programs. These started in 1961 for corn, wheat and sorghum, 1962 for barley, 1964 for cotton, 1976 for rice, 1982 for oats, and 1998 for soybeans. The evidence is very clear that farmers were penalized toward these changes, not rewarded toward them.
Iowa, though it has had some of the very biggest subsidies, also seems to be the state with the biggest reductions, resulting in the biggest net reductions over the long haul (net = market reductions below parity standards + subsidies). Iowa is the biggest farm bill loser, as is the cornbelt region.

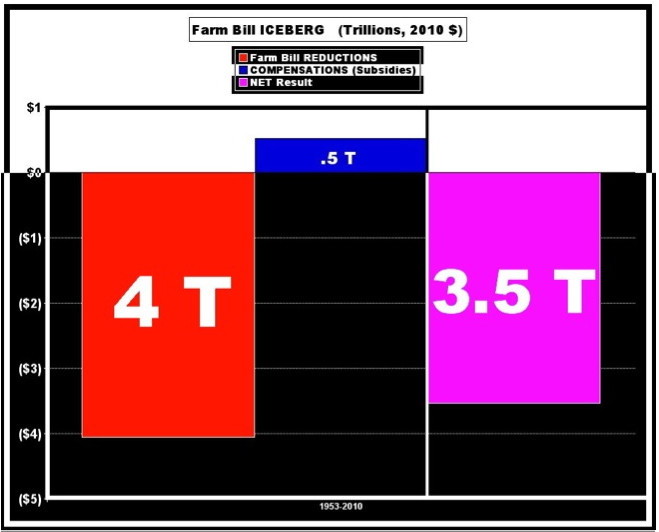
Nationally the reductions since 1953 add up to trillions of dollars, so these are huge issues affecting agriculture, and affecting agriculture’s impact on climate.
US net farm income in 2016, (adjusted for inflation and including farm subsidies,) was less than 50% of what it had been during the parity years of 1942-52. Net Farm Income for Iowa in 2016 was less than 35% of what it had been for 1949-1952, (the earliest years for which data is available).
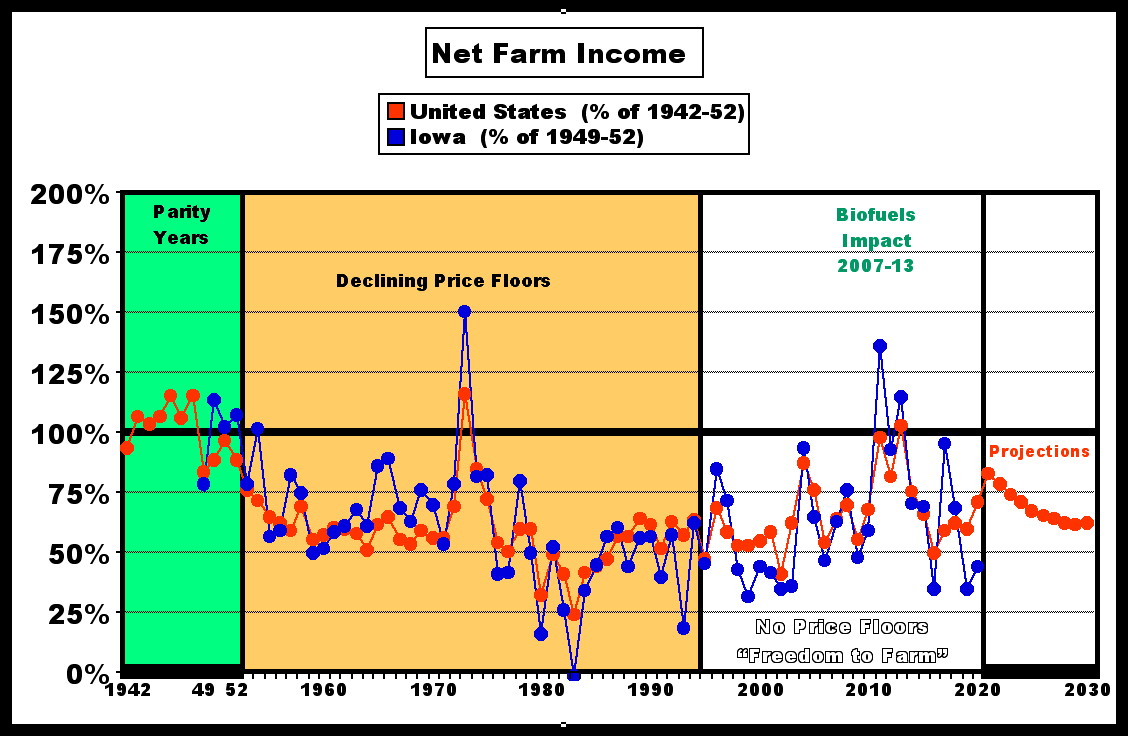
That’s in spite of much increased yields for crops like corn and soybeans.
Nearly 60% of farmers were run out of business during the massive reductions in farm income. Losses of farms livestock and poultry poultry occurred at an even faster rate, especially for hogs, dairy and poultry. According to data from the Census of Agriculture, between 1950 and 2017, Iowa lost 97% of its farms with hogs land pigs, 98% of it’s farms selling poultry products, and 99% of its farms with milk cows. It also lost 86% of its farms with cattle and calves and 88% of its farms with sheep.
Losing livestock from farms was very damaging to the environment, leading to our poor water quality, contributing to the dead zone in the Gulf of Mexico and to climate change. That’s because, without farms with livestock, we also lost farms with the sustainable “livestock crops” like grass pastures, alfalfa and clover hay, and nurse crops like oats and barley. Farms with these sustainable crops were also lost at a much faster rate than the loss of farmers and the loss of crop farmers. For example, according to Census of Agriculture Data, between 1950 and 2017, Iowa lost 82% of it’s farms with hay, 96% of its farms with pasture on cropland, and 99% of its farms with oats.
As a result of these losses, farmers have lost much of the economic viability for these sustainable crops and diverse crop rotations, which are especially needed on hills and near streams. These areas have been increasingly planted to corn and soybeans. We’ve then seen increasing destruction of the infrastructure for sustainability on farms, in small towns, and across rural regions.
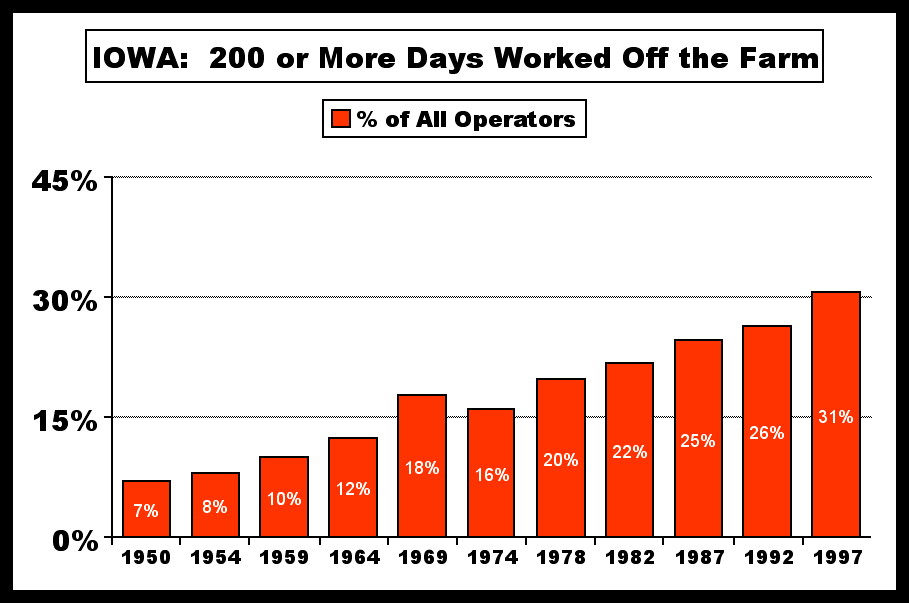
A related factor is that, while 92% of Iowa farm operators reported farming as their primary occupation in 1950, by 1997 only 61% of the remaining farmers did, and for some counties, less than half. And while only 7% of Iowa farm operators worked 200 or more days off the farm in 1950, by 2017 31% of the surviving farm operators did. These changes were reflected in farming’s share of total farm household income. While in the early 1960s, when USDA’s data series on this begins the farm portion of total farm household income was nearly 50%, this figure fell to just 12% by the 1990s and 11% for 2000-2009, even with the start of the biofuels boom. Those temporarily higher prices continued for corn, soybeans and rice through 2013, and the farm share of farm household income rose for 2010-2019, but only to 20%.
I’ve documented many these changes away from sustainability for Iowa, for 42 counties in Iowa, and with summaries of this data for each of the 4 Congressional districts in Iowa, (9+9+12+12=42 county summaries + 4 District summaries).
(See data charts here, organized by the new Congressional Districts: The Decline of Farming in 9 Counties of Iowa’s 1st Congressional District: Environmental Impacts [10 slide shows]: https://drive.google.com/drive/folders/11Ii_bwimdYxDjC-pyuYKm3mYLVGJfsXF; The Decline of Farming in 9 Counties of Iowa’s 2nd Congressional District: Environmental Impacts [10 slide shows]: https://drive.google.com/drive/folders/1WUkjXENDtc0XimXxzDA47adZ-6KqHXxc; The Decline of Farming in 12 Counties of Iowa’s 3rd Congressional District: Environmental Impacts [13 slide shows]: https://drive.google.com/drive/folders/1a_muA-EeV8nX_mjqzCIfjowjcGLr3PkL; The Decline of Farming in 12 Counties of Iowa’s 4th Congressional District: Environmental Impacts [13 slide shows]: https://drive.google.com/drive/folders/185K4Wiu43x_rmWmhXPY6EGItYJHqay0b. For all of Iowa [99 counties,] seehttps://www.slideshare.net/bradwilson581525/the-decline-of-farming-in-iowa-pt-1pdf. See Iowa charts below.)


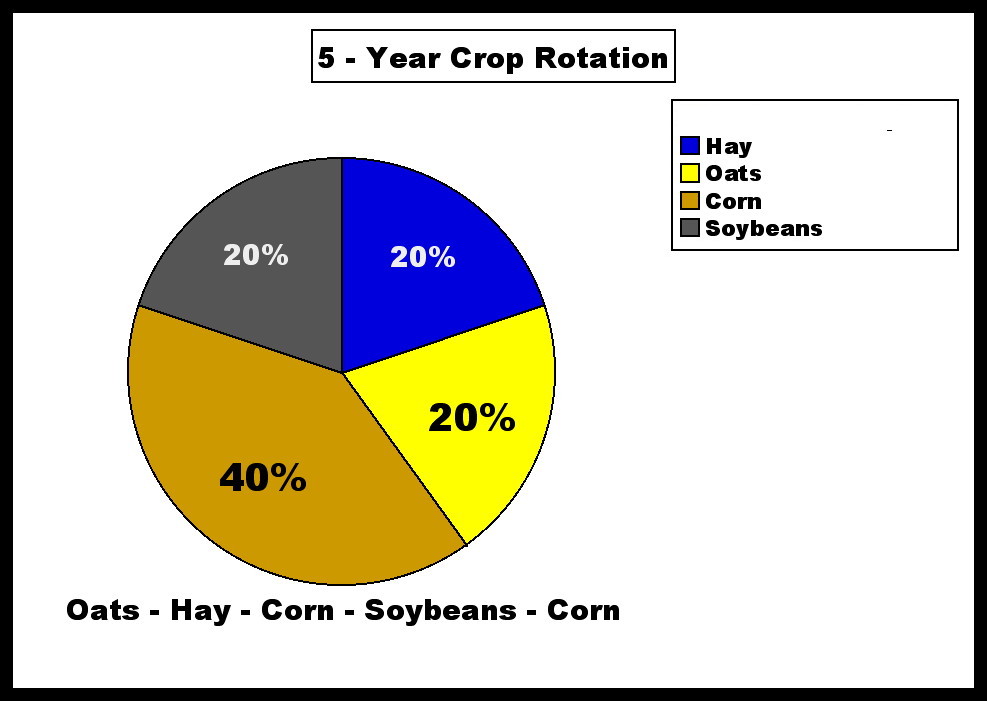
Examination of the acreages for these crops shows more clearly how they affect crop rotations. Without the diversity of the sustainable livestock crops, most of Iowa has been reduced to a simple corn-soybeans rotation, (corn-following-soybeans,) leading to damage to the environment, especially on hills and near streams. The slide shows compare the changes in these acreages, shown in pie charts, to various crop rotations, (including acreages for soybeans and “other,”) jumping from 1950 to 1969 to 1992 to 2017.
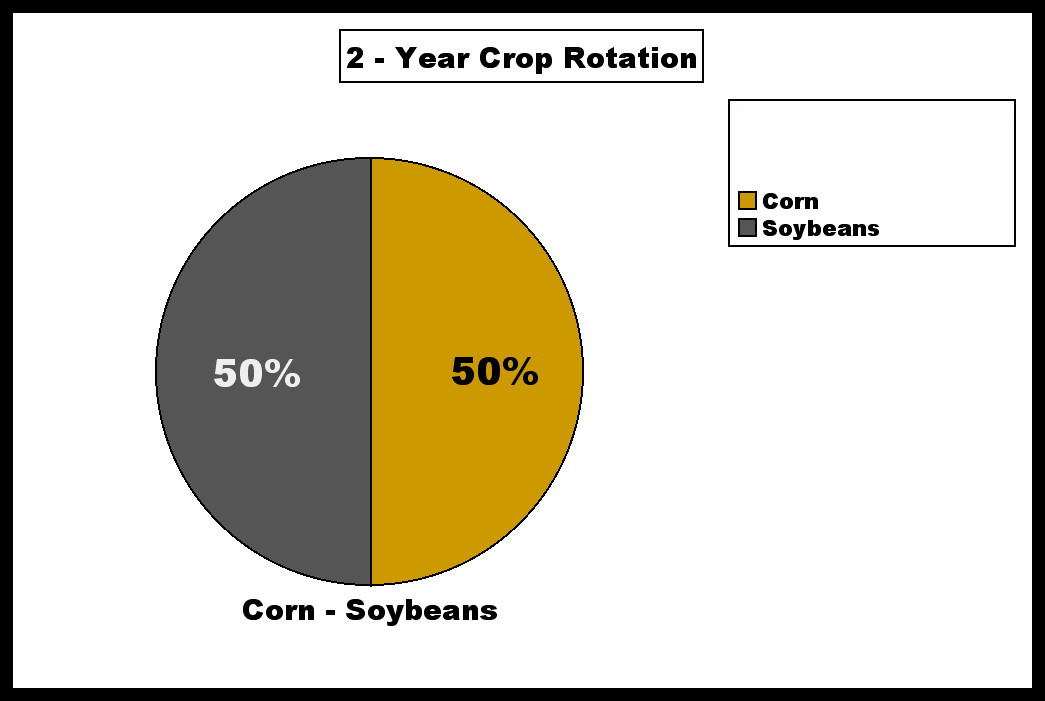
Compare the two-year, corn-soybeans rotation, above, with the five-year rotation shown below, which has been popular among organic farmers in Iowa.
Compare that with the acreage results for the state of Iowa in 1950 and 2017, below.
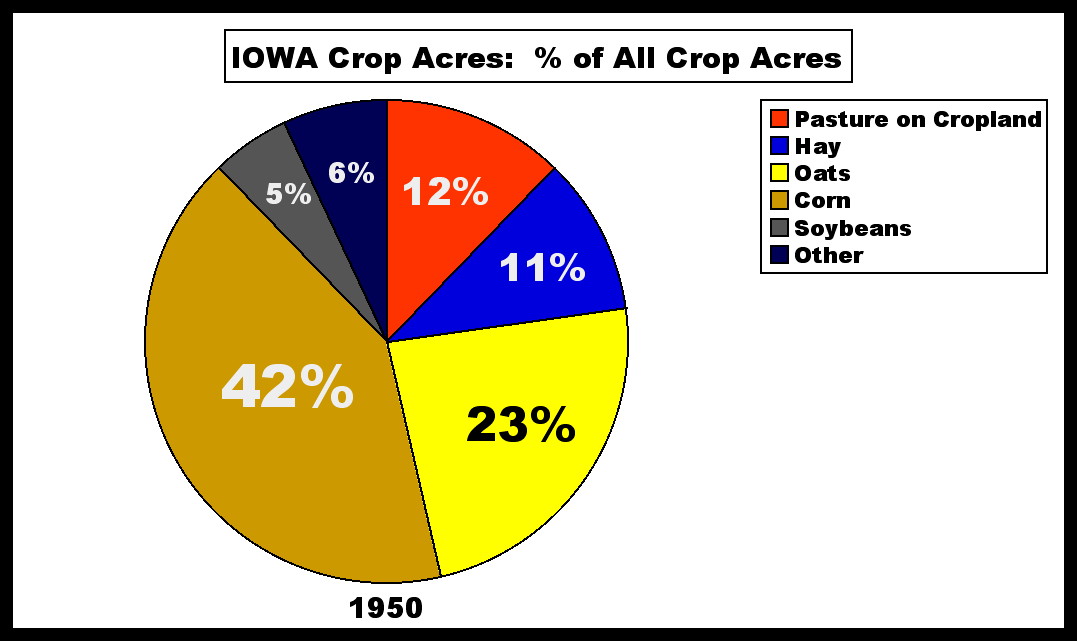
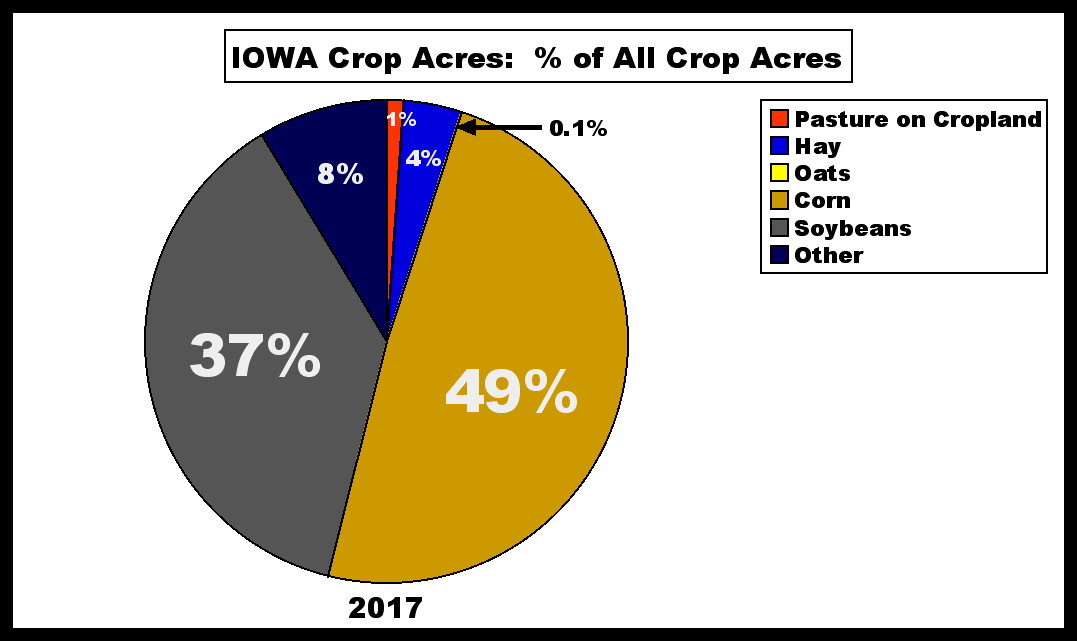
Iowa’s diverse pie pieces have shrunk! Iowa has lost the possibility for sustainable crop rotations.
The increasing role of off-farm jobs and income for those farm operators who have survived, and as the percentage of young farmers declined and the percentage of old farmers rose has also affected the environmental impacts of Iowa agriculture. These statistics mean that farmers had less availability of labor on farms and relatively more capital from off-farm sources. The quite old farmers of today want to do less labor and they have more capital than young farmers do. These changes during the period of declining farm prices and income has fostered systems of “tax loss farming,” favoring those with higher off-farm incomes and those in higher tax brackets. They got bigger tax write-off subsidies per acre, (assuming identical farms,) than farmers with lower total incomes. This also magnified the loss of diversity and sustainability on farms, and increased the use of purchased inputs, like fertilizers, pesticides, and larger machinery.
Slide shows on these farmer impacts for each the 42 counties (and 4 Congressional districts) are not complete yet, but the one for all of Iowa is available here: https://www.slideshare.net/bradwilson581525/the-decline-of-farming-in-iowa-part-2-farmer-impacts.
In general, with much lower net incomes per acre, and with the loss of several kinds of value-added livestock/poultry from a large majority of farms, farms have had to get much bigger in acres to stay the same economic size, which is another systemic factor working against diversity and sustainability.
To address a wide range of issues, including those of rural economic and community health, rural environmental decline, and agriculture’s impacts on climate, changes are needed in the federal farm bill to restore programs of market management for economic justice. Iowa farmers need the kinds of Democratic Party Price Floor and Supply Management programs that we had in the past. Proposals to do this have been available for decades, and there have been many econometric studies showing this approach is much better than each of the increasingly Republican farm bills we’ve seen from 1980 to 2014. These proposals have come from the organizations of the Family Farm (Farm Justice) Movement, including support from the National Farmers Organization, the American Agriculture Movement, the North American Farm Alliance, the National Family Farm Coalition, the National Farmers Union, and the Texas Farmers Union. Many of them address the dairy portion of the farm bill, which has been hurt so much by the cheap prices that have forced farmers to subsidize CAFOs. These proposals were much cheaper than each of the Farm Bills, (farm bill baselines,) that they were compared with. They each would have significantly reduced the huge CAFO and junk food subsidies of these farm bills, and would also have reduced the export dumping of these decades, where the United States has been losing money on farm exports, subsidizing foreign countries while damaging the economy, the environment, public health, and rural community life here.
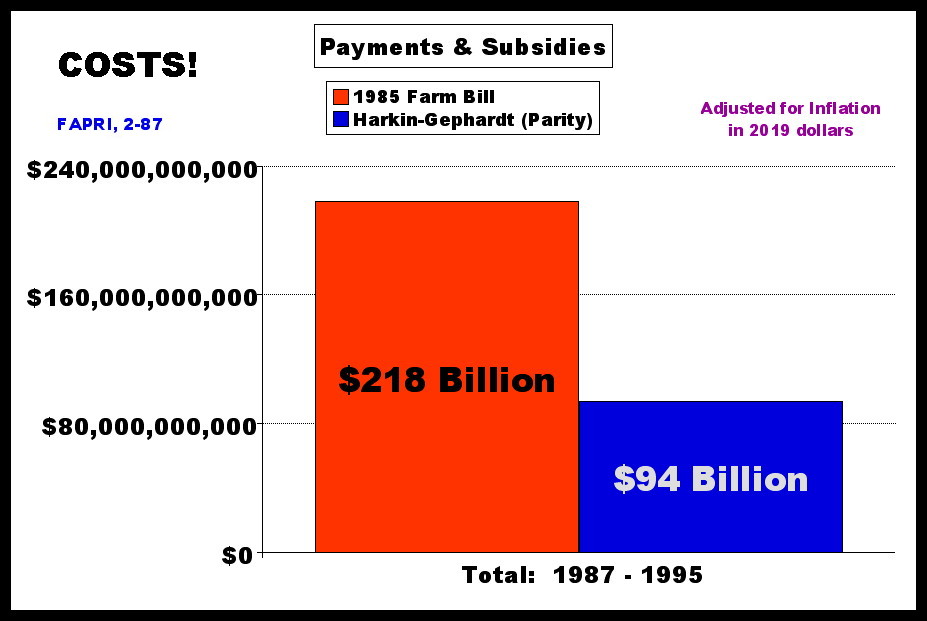
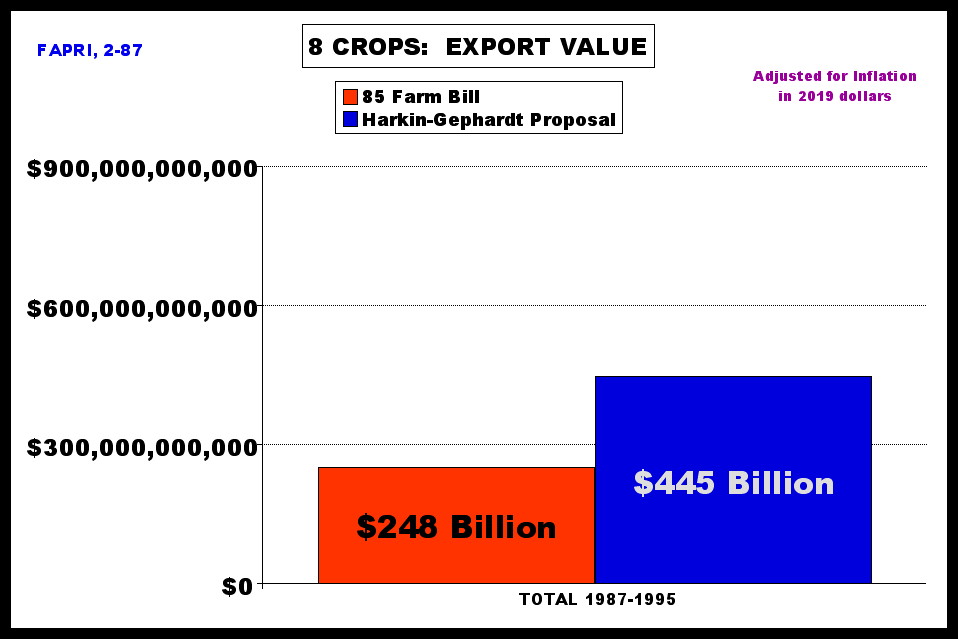
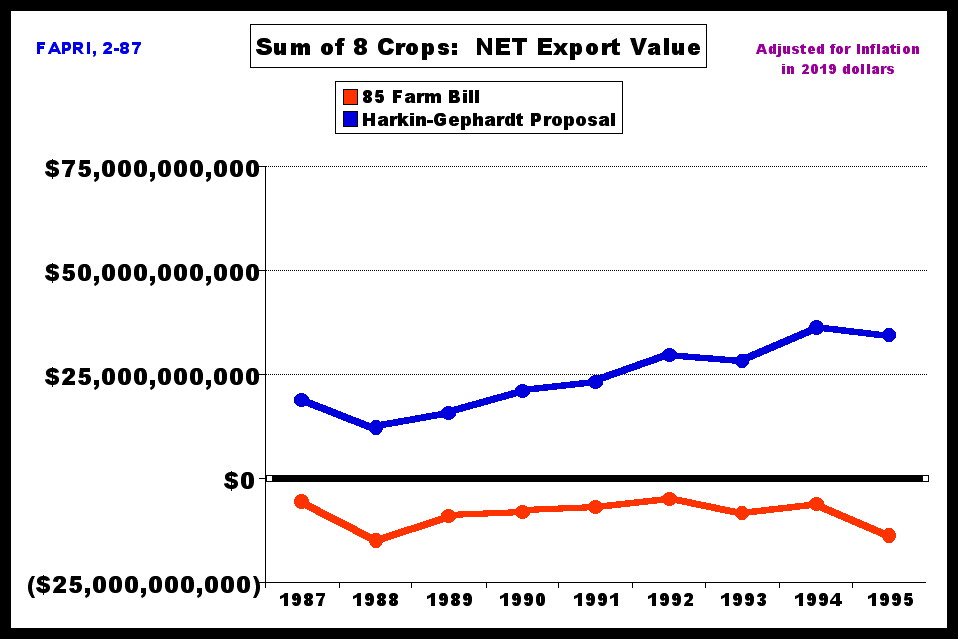
One of the most comprehensive of these studies was the FAPRI, (Food and Agricultural Policy Research Institute,) study of the 1987 Family Farm Act, (Harkin-Gephardt proposal). (https://familyfarmjustice.me/2016/12/09/family-farm-act-of-1987/). FAPRI found that the Harkin-Gephardt proposal would have greatly increased Net Farm Income and income from farm exports, as in the charts below. (The charts below are adjusted for inflation in 2019 dollars, and therefore different than those at the link above.)

At the same time, Harkin-Gephardt would have greatly reduced the costs of these core farm programs to government and taxpayers.
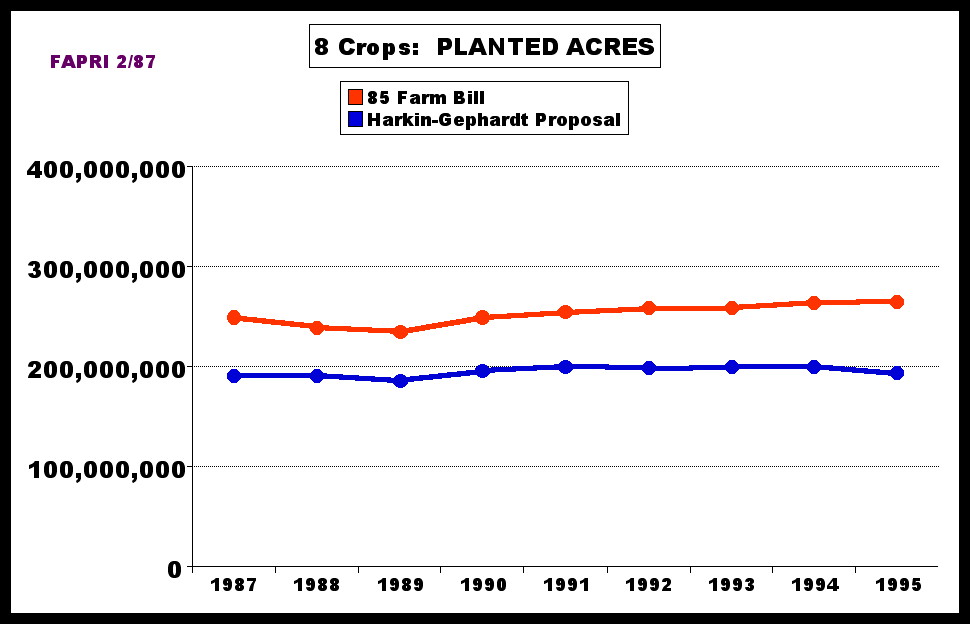
For the 8 major crops studied, the programs would have reduced acreages below the inadequate levels of the 1985 Republican Farm Bill.
This would have resulted in reduced production of the 8 crops, to prevent oversupply and cheap prices, as seen in the chart below of 6 of the crops where production can be measured in bushels.

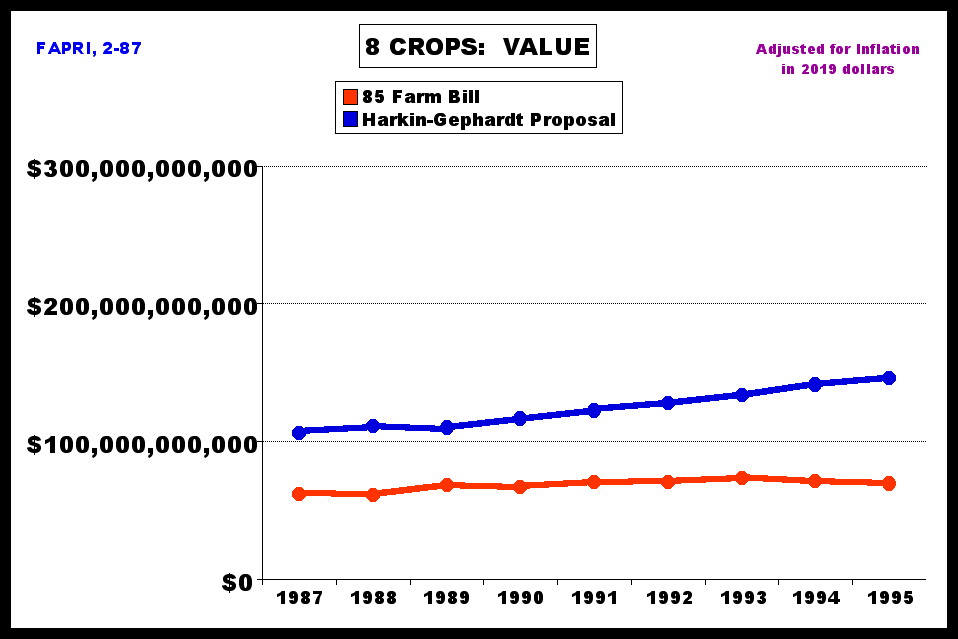
The value of the 8 crops would then be much higher, however, under Harkin-Gephardt than under the 1985 Farm Bill.
A similar pattern would have been seen for exports. The quantity exported under Harkin-Gephardt would have been significantly smaller, as seen in the chart below featuring 6 crops measured in bushels. Similar patterns were found for cotton and rice.

On the other hand, income from exports was found to be much higher with Harkin-Gephardt.
If USDA-ERS “full cost”* figures are applied to the FAPRI data, we also see that the Harkin-Gephardt proposal would result in exports above zero, while the 1985 Farm Bill that President Reagan signed would have farmers losing money on their investments. (*Here USDA “full costs” include a wage equivalent for the farmer, plus a portion of general farm overhead and other factors. So the resulting figures are a return to a farmers’ investments in land, machinery and facilities.)
Because the Harkin-Gephardt farm bill proposal would significantly raise the costs of grain for feeding livestock, ending CAFO subsidies, it was found to affect farming systems in ways that would help the environment. For example, there would be more forage, (grass, alfalfa, clover,) and less feeding of grain in CAFOs and feedlots. According to the study, (https://econpapers.repec.org/paper/agsfaprsr/244143.htm):
“a major shift in the type of meat produced would occur concurrently with the shift toward less production.”
“As feed costs increase toward an 80% parity level, producers shift away from grain-fed animals and utilize available forage to add weight to beef.”
“… the higher costs of beef production associated with parity crop pricing would likely push the industry toward an animal which matures (finishes) at a lighter weight and could be forage-fed for a substantial part of the weight-gaining process.”
“Such an adjustment would be costly to current feedlot operators.”
Our macro, systemic conclusion is clear. We can’t fix sustainability for agriculture without restoring economic distributive farm justice.

Pingback: Farm Subsidy Myths and Other Myths at Lancet | familyfarmjustice